After getting too tired to work tonight, I realized I had no Netflix and that I’m bored with the books I’m reading. Therefore, I present visualizations of several solutions I’ve received to my saturating arithmetic homework over the years.
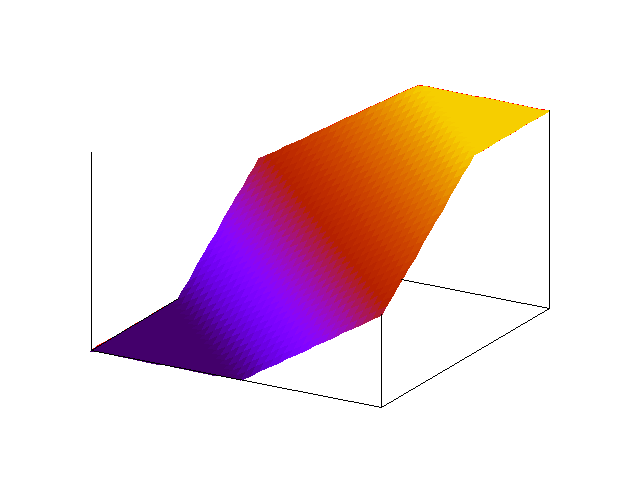
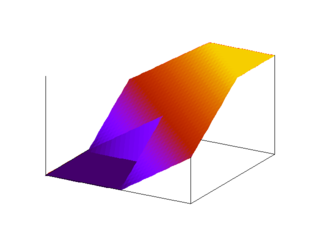
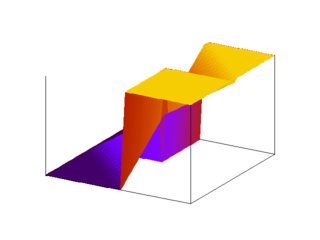
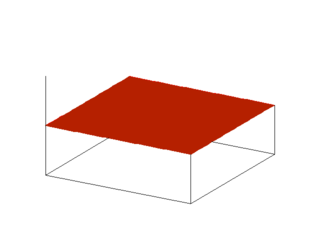
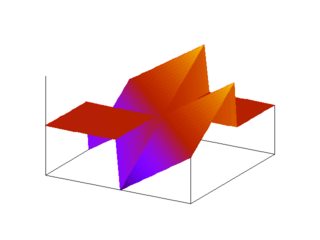
This is what a correct saturating signed add looks like, where the z-axis is the output:
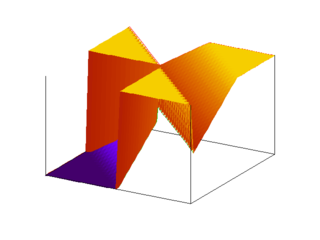
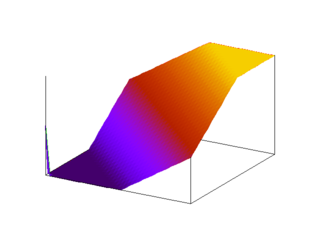
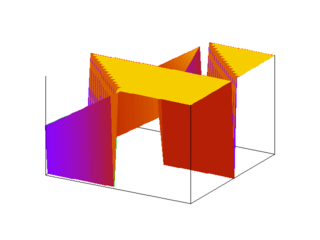
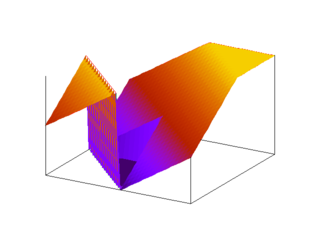
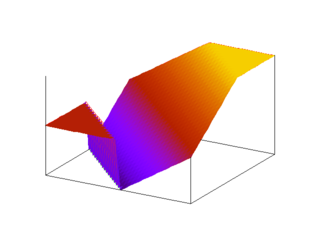
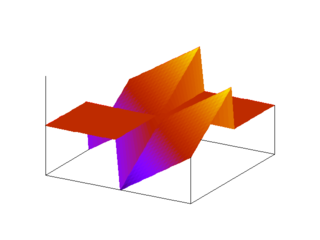
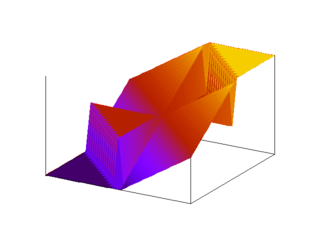
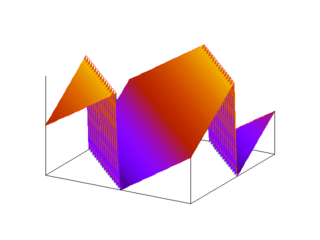
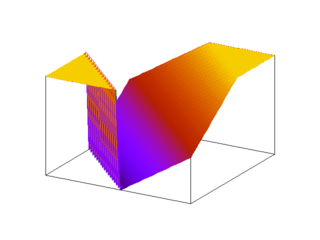
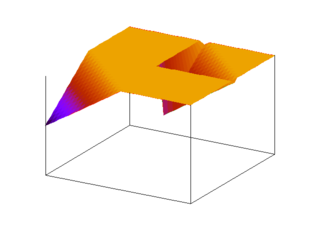
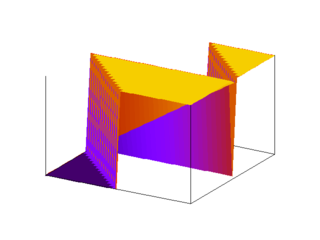
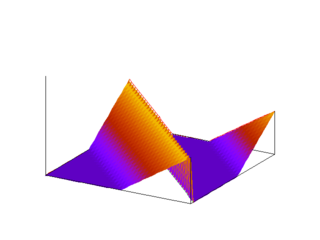
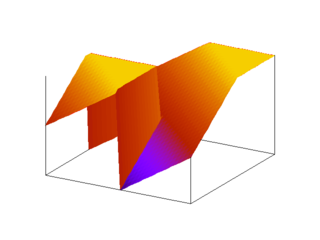
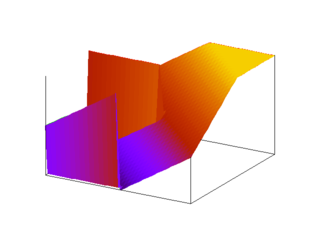
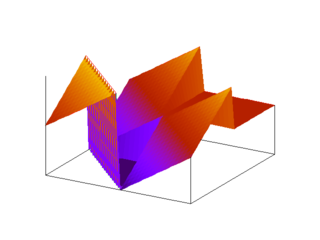
Here are some solutions that are incorrect. I love the ones that look like origami cranes.


One response to “Visualizing Math Bugs”
Brings back memories of the Numerical Methods class. Matlab used to be such as good friend.