It’s frustrating when an experiment reveals an almost, but not quite, statistically significant effect. When this happens, the overwhelming temptation is to run a few more repetitions in order to see if the result creeps into significance. Intuitively, more data should provide more reliable experimental results. This is not necessarily the case.
Let’s look at a concrete example. We’ve been handed a coin and wish to determine if it is fair. In other words, we’ll conduct an experiment designed to see if the null hypothesis (“the coin is fair”) can be rejected at the desired level of confidence: 95% in this case. Just to review, informally a result with 95% confidence means that we are willing to accept a 5% chance that our experiment reaches a false conclusion.
Consider this graph:
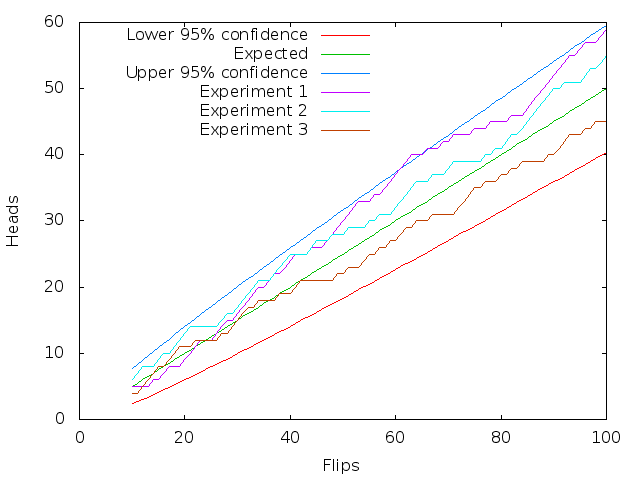
The x-axis shows a range of experiments we might be willing to perform: flipping the coin between 10 and 100 times. The red line is the lower confidence bound: the smallest number of heads that indicates a fair coin at the 95% level; the green line indicates the expected number of heads; and, the dark blue line indicates the upper confidence bound: the largest number of heads that is consistent with the coin being fair at the 95% level. The remaining three lines are examples of the kind of random walk we get by actually flipping a coin (or consulting a PRNG) 100 times.
Let’s say that we have decided to flip the coin 40 times. In this case, the 95% confidence interval (using the Wilson score) has a lower bound of 14.1 and an upper bound of 25.9. If we perform this coin flip experiment many times, the coin is declared to be fair 96% of the time — a good match for our desired level of confidence. If we instead flip the coin 80 times, the 95% confidence interval is between 31.4 and 48.6. This new experiment only finds the coin to be fair about 94% of the time. This mismatch between desired and actual coverage probability — which is often, but not always, minor — is an inherent feature of binomial confidence intervals and I’ve written about it before.
So now let’s get back to the point of this post. The question is: How are the results affected if, instead of selecting a number of repetitions once and for all, we run a few reps, check for significance, run a few more reps if we don’t like the result, etc. The setup that we’ll use here is:
- Flip the coin 10 times
- Check for an unfair coin — if so, stop the experiment with the result “unfair”
- If we’ve flipped the coin 100 times, stop the experiment with the result “fair”
- Flip the coin
- Go back to step 2
The graphical interpretation of this procedure, in terms of the figure above, is to look for any part of the random walk to go outside of the lines indicating the confidence intervals. The light blue and brown lines do not do this but the purple line does, briefly, between 60 and 70 flips.
The punchline is that this new “experimental procedure” is able declare a fair coin to be unfair about 37% of the time! Obviously this makes a mockery of the intended 95% level of confidence, which is supposed to reach an incorrect conclusion only 5% of the time.
Does this phenomenon of “run a few more reps and check for significance” actually occur? It does. For example:
- People running experiments do this.
- Reviewers of papers complain that the results are not “significant enough” and ask the experimenter to run a few more reps.
- I’ve seen benchmarking frameworks that automatically run a performance test until a desired level of confidence is achieved.
In contrast, near the start of this paper there’s a nice story about experimenters doing the right thing.
11 responses to “Do Not Just Run a Few More Reps”
You write, “In contrast, near the start of this paper there’s a nice story about experimenters doing the right thing.” But did they really do the right thing? The researchers apparently suppressed results that they thought were too uninteresting to publish, a typical example of the “file drawer” effect. They should surely have published, in the “Journal of Articles in Support of the Null Hypothesis” if no other journal would take the paper. Otherwise, how will other researchers running the same or similar experiments be aware of this prior failure?
“Reviewers of papers complain that the results are not “significant enough” and ask the experimenter to run a few more reps.”
I don’t see it this way. I think reviewers are asking the experimenter to redo the entire experiment, this time choosing in advance a larger (but fixed) number of samples. (1)
(2) Of course, the reviewers are honest and reach this conclusion as they read the “protocol” section of the article, before having seen the “results” section.
PS: Actually, if reviewers did (2), then the experimenter would not need to do (1): it would be fair game to reuse results from the first experiment because the decision to enlarge it was not based on its results.
This sounds exactly like an example that Jaynes uses in “Probability Theory: The Logic Of Science” to demonstrate the problems with frequentism. See also
http://blog.richmond.edu/physicsbunn/2012/01/05/who-knows-what-evil-lurks-in-the-hearts-of-men-the-bayesian-doesnt-care/
Paul, thanks for the references! I want to say that my goal, as far as statistics goes, is to be barely sophisticated enough to be a competent scientist, but actually I really enjoy this stuff and wish I had more time and energy to devote to it.
Hi Pascal, consider the “real sciences” where the cost of running experiments can be substantial. If the experimenters have already run 30 subjects and the reviewer asks for 5 more, the general understanding (or so the real scientists tell me) is that the request is to run 5 more subjects, not 35 more, which may well be prohibitive.
Hi Gareth, you’re right, but realistically science is not set up to encourage publication of negative results. Perhaps this is best accomplished in a more informal format such as blog entries.
One way of looking at it is: every time you add-data-and-check-significance is a new experiment. If you conduct 20 experiments (data points 1..5, 1…10, 1…15, … , 1..100) it should be expected one of them will give a 95% significance result that is incorrect.
Can this be summarized as a requirement that p < (1 – 1/n) where n = the number of distinct (possibly overlapping) data sets inspected for significance?
This is a problem even if you do it the “journal paper review” way where you fix for a bigger N each time keep repeating new sets of experiments until you get significance. I think mathematically, though, “do it once, if the results aren’t significant add a bunch more data” is bad but not quite in the ballpark of the “you can only win this game” iteration until significance. How bad is the practice of reporting a small sample with suggestive non-significant results in a workshop paper, then presenting a large data set (that might include the original runs due to compute cost) in a conference paper? Or the same practice from conference to journal?
Run to 10, publish, run to 30/100/500 whichever, but pick one, publish if significant — the bad part here is mostly in the “publish if significant” side. Which is more about publication rewards than about statistics, in a way.
Sadly, “The Journal of Articles in Support of the Null Hypothesis” is not very prestigious. In practice, non-significant bigger experiments mostly fall on the floor un-noticed, unless they contradict a known important claim in the field. There’s even _some_ rational basis for this — the set of “things that aren’t true” is very very large, and science is partly a game of finite attention.
>>this new “experimental procedure” is able declare a fair coin to be unfair about 37% of the time!
How did you come up with 37%?
Hi Ethan, the 37% came from repeated simulation. It’s not much code but I didn’t post it due to not having cleaned it up.
Hi bcs, I know there are principled ways to look for significance across a collection of experiments, but I have never tried to use them in practice.