[My father, David Regehr, encouraged me to write this piece, provided some of its content, edited it, and agreed to let me use data from his farm.]
[For readers outside the USA: Alas, we do not farm in metric here. In case you’re not familiar with the notation, 10″ is ten inches (25.4 cm) and 10′ is ten feet (3.05 m). An acre is 0.4 hectares.]
Agriculture and technology have been intimately connected for the last 10,000 years. Right now, information technology is changing how we grow food; this piece takes a quick look at how that works.
Measurement
If soil conditions aren’t right, crops will grow poorly. For example, alfalfa grows best in soils with a pH between 6.5 and 7.5. Soils that are too acidic can be “fixed” by applying ground limestone (CaCO3) at rates determined by formulae based on chemical analysis. The process typically begins with taking soil samples (to an appropriate depth) in a zig-zag pattern across each field, mixing the samples in a bucket, and then sending a sub-sample to a laboratory where it’s analyzed for pH, cation exchange capacity, major nutrients such as phosphorus, potassium, and sulfur, and micro nutrients such as zinc. For more details, see this document about interpreting soil test results.
Applying a uniform rate of ag (agricultural) lime to an entire field is suboptimal where there is variation in soil pH within the field. Ag lime applied where it is not needed is not only a waste of money, it can raise soil pH to a point that is detrimental to crop growth. To characterize a field more accurately, it needs to be sampled at a finer granularity. For example, GPS grid lines can be super-imposed on a field to locate points each representing an area of, say, 2.5 acres. Around each such point, ten or more soil samples would be taken along a 30′ radius, mixed, sub-sampled, and GPS-tagged. From the resulting analysis, the lime requirement, and adequacy of other nutrients essential for plant growth, of all areas in the field can be interpolated using a model.
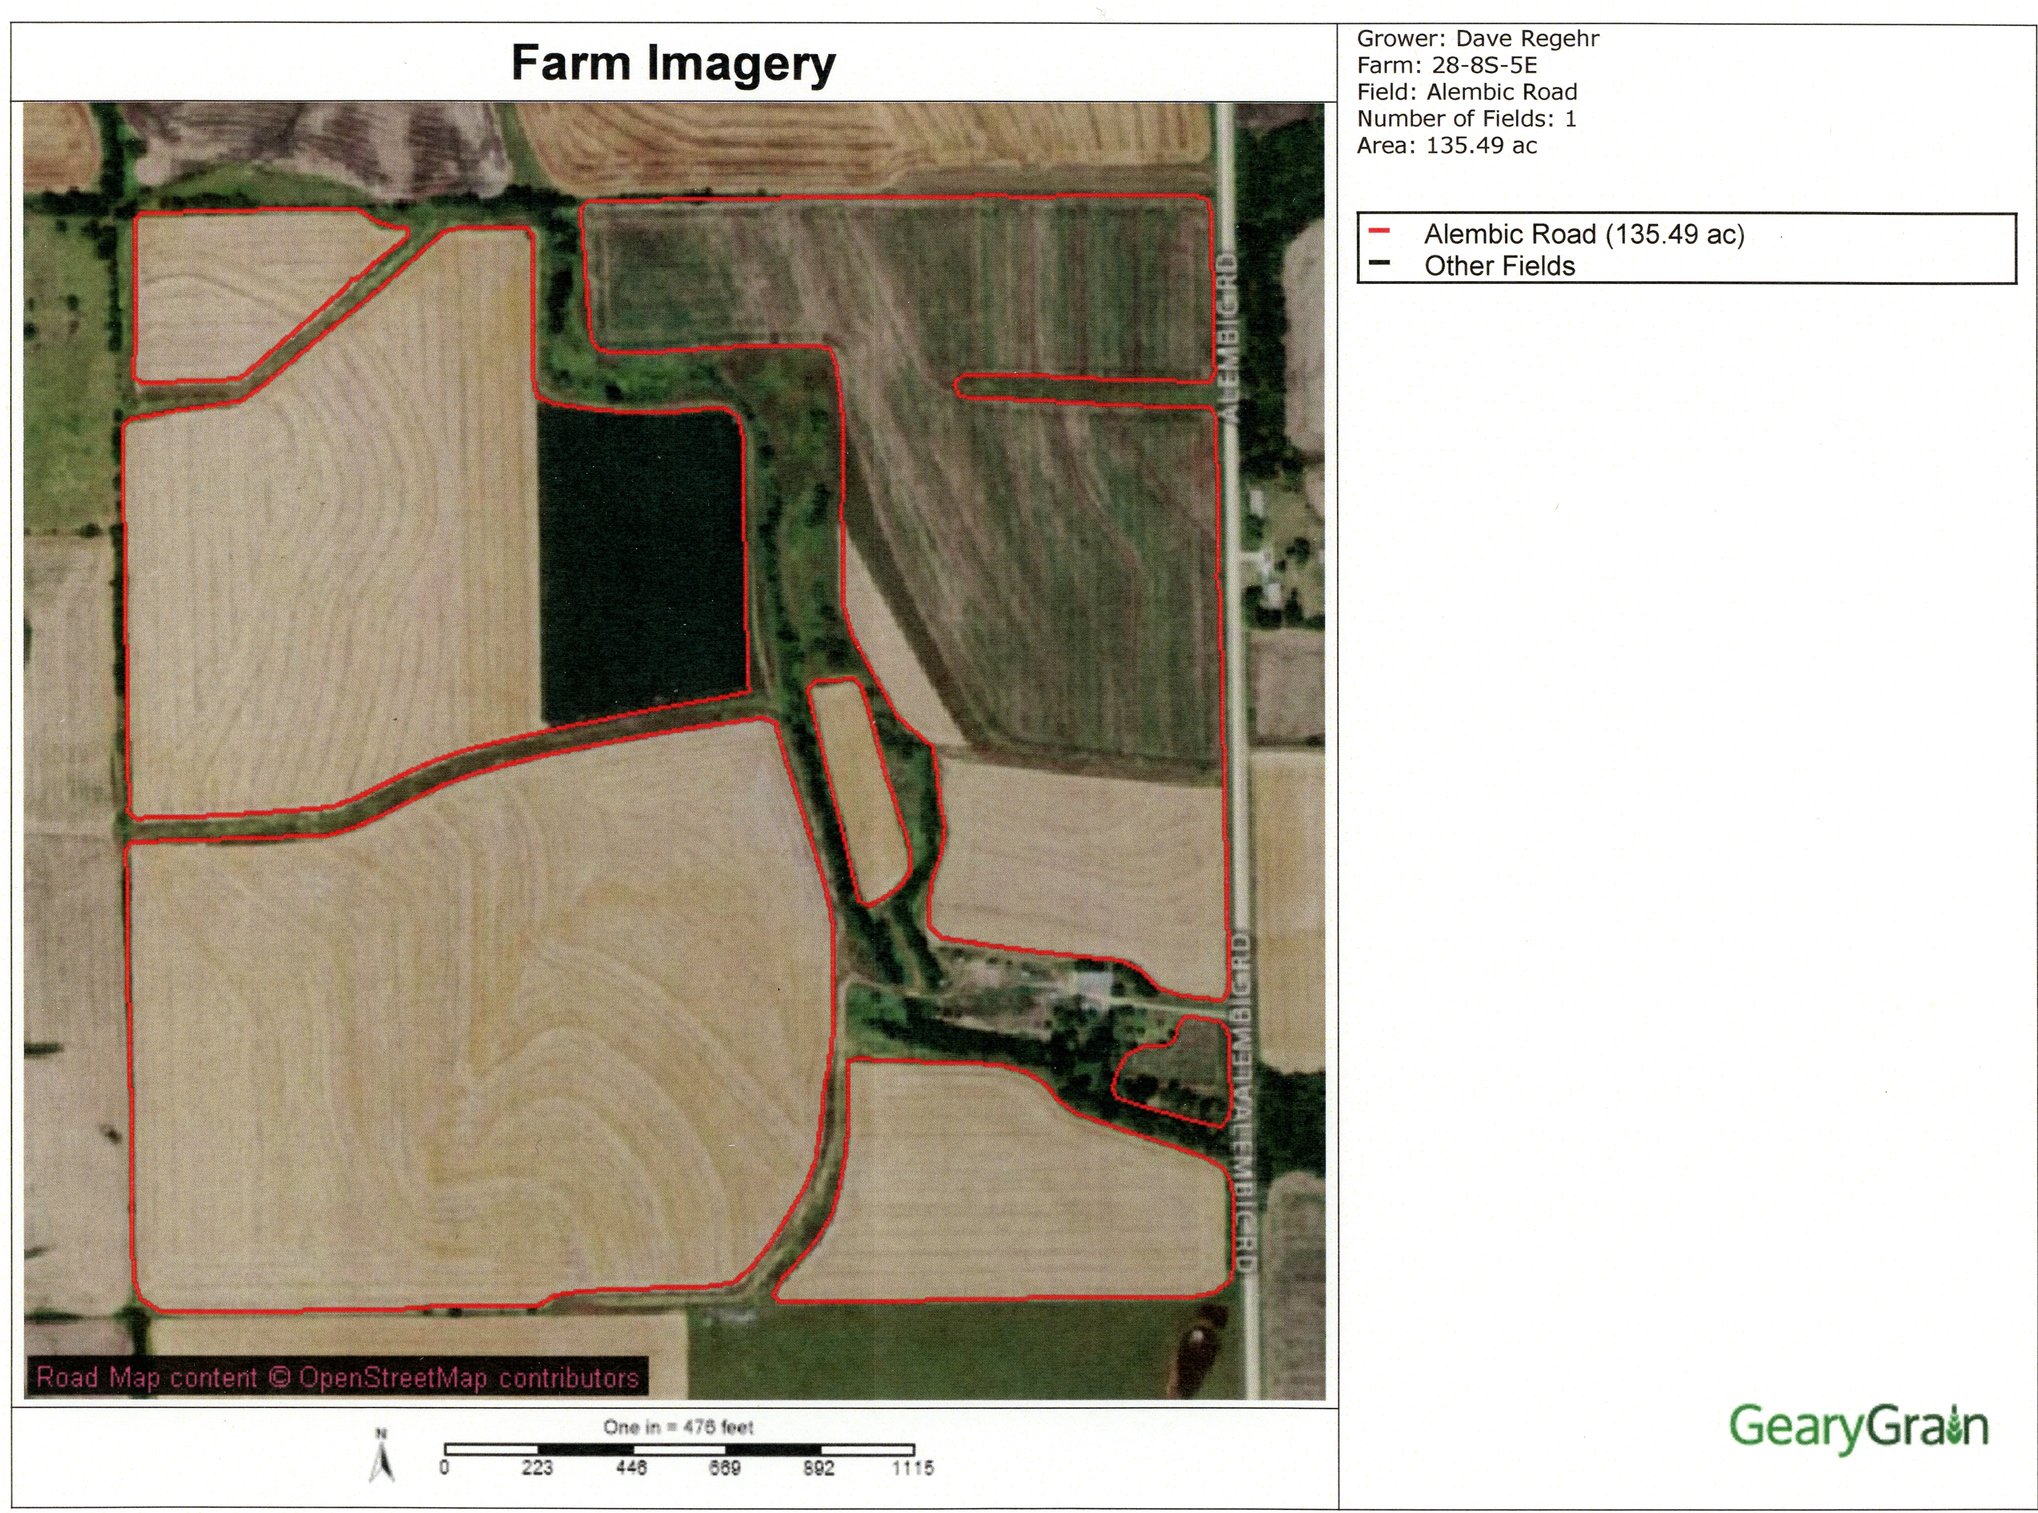
Let’s look at an example. This image shows the farm near Riley KS that my parents bought during the 1980s. I spent many afternoons and weekends working there until I moved out of the area in 1995. It’s a quarter-section; in other words, a half-mile on a side, or 160 acres. 135.5 of the acres are farmland and the remaining 24.5 are used by a creek, waterways (planted in grass to prevent erosion), buildings, and the driveway.
This image shows the points at which the fields were sampled for soil analysis in November 2015:
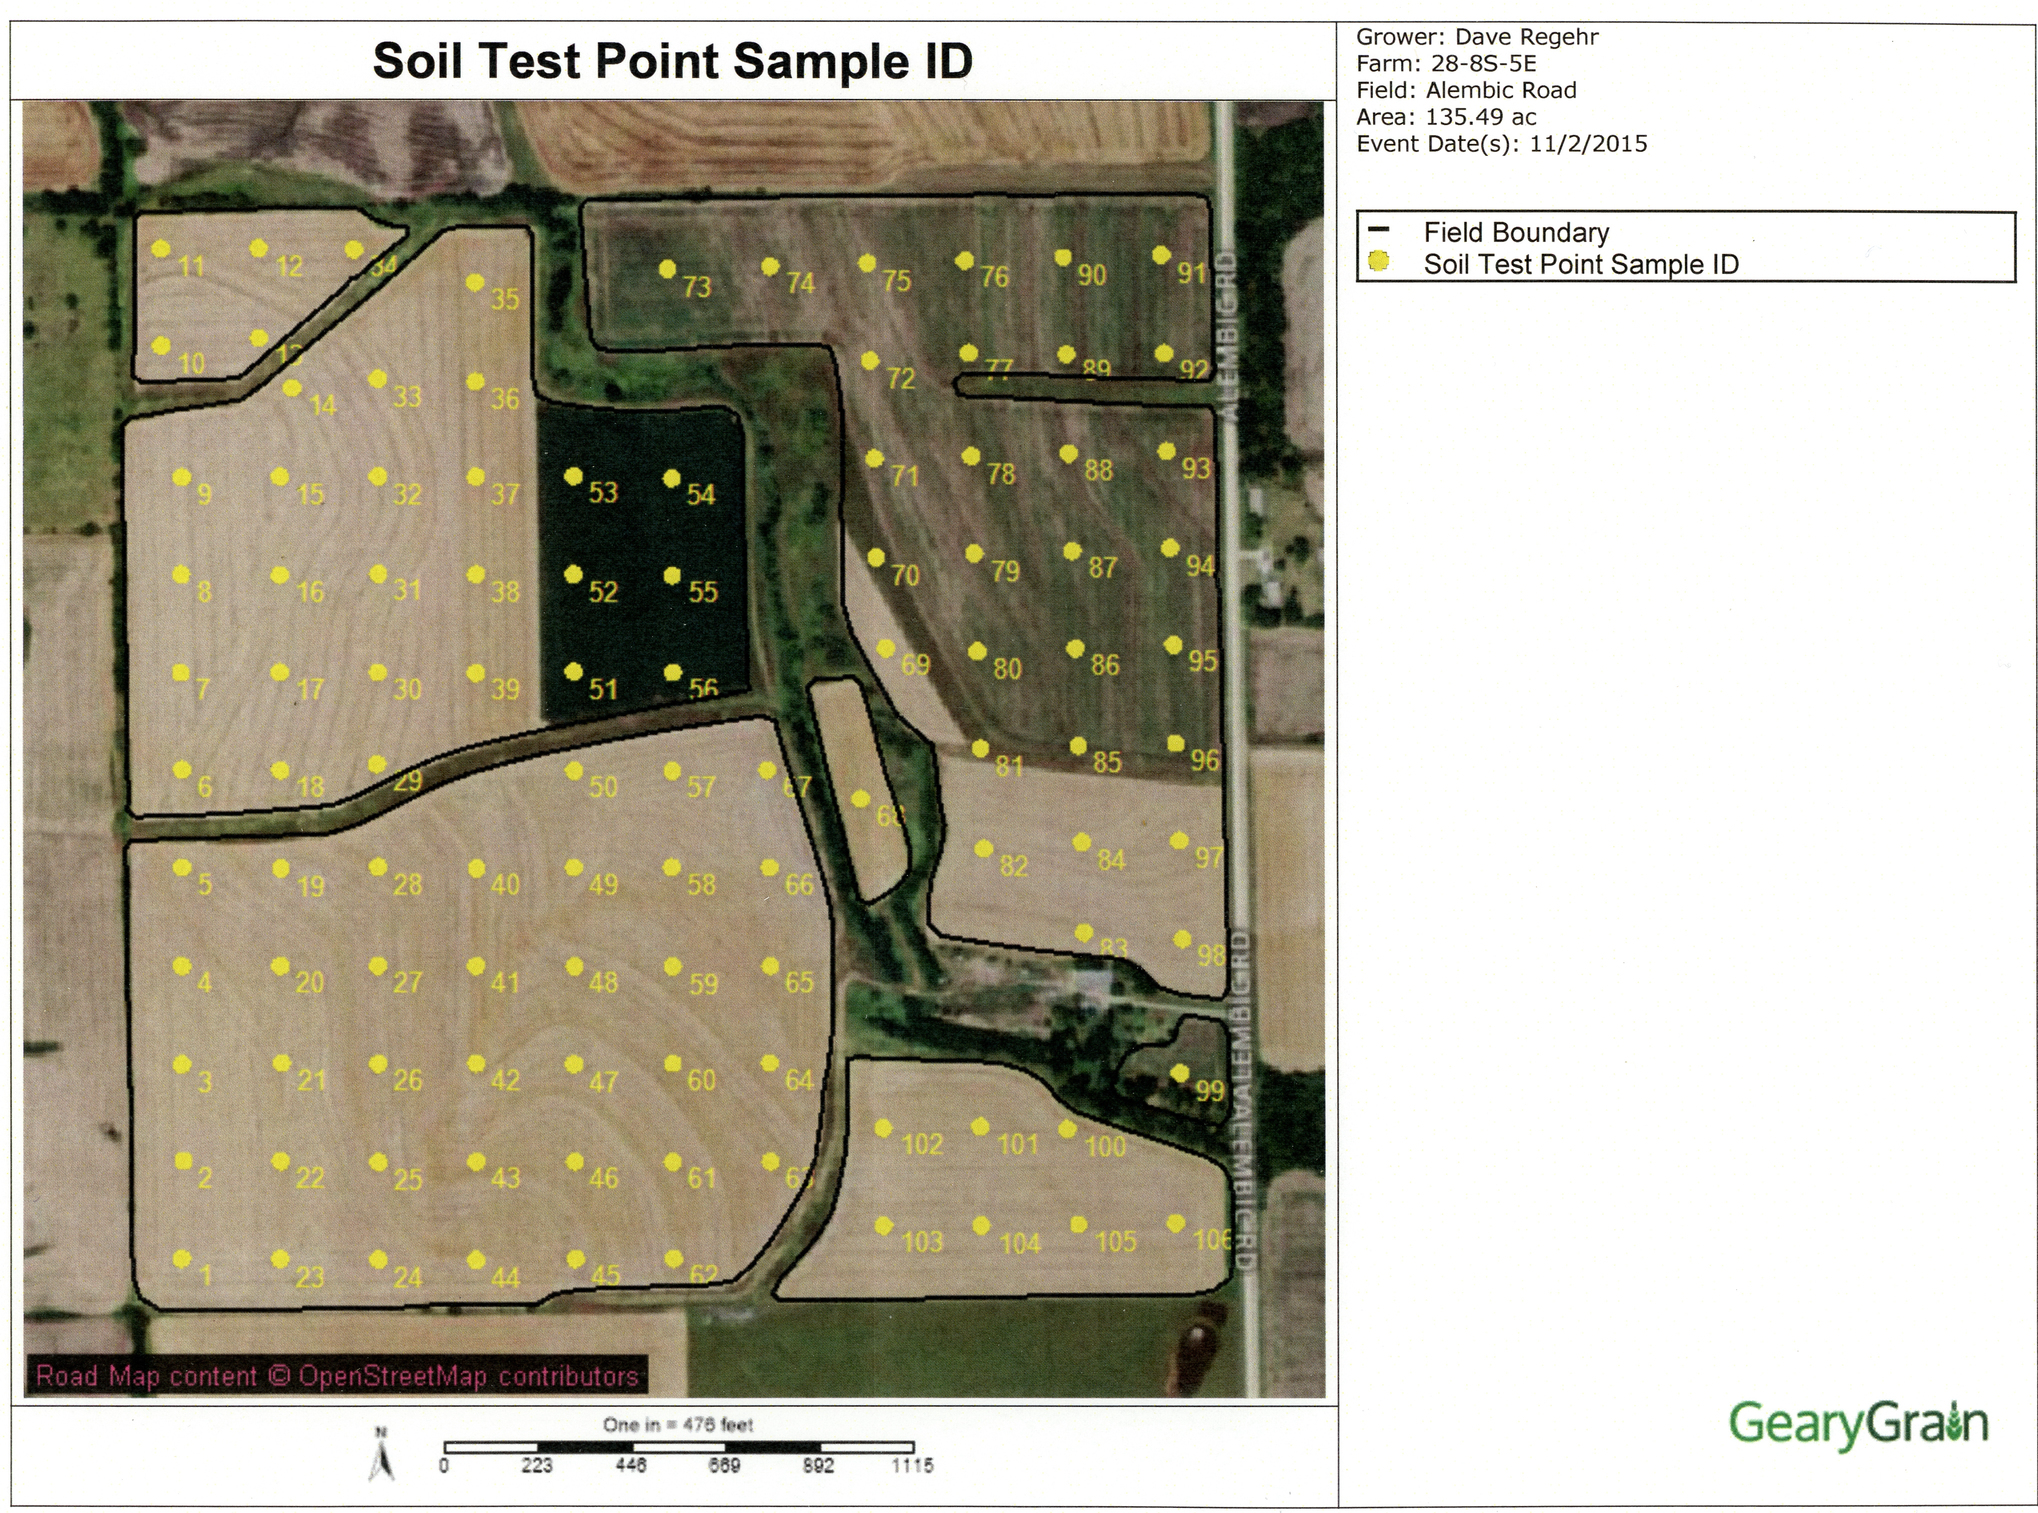
Each point represents a 1.25 acre area; this is pretty fine-grained sampling, corresponding to relatively small fields with terraces and other internal variation. A big, relatively homogeneous field on the high plains might only want to be sampled every 5 or 10 acres.
Here are the soil types:

This image shows how much sulfur the soil contains:
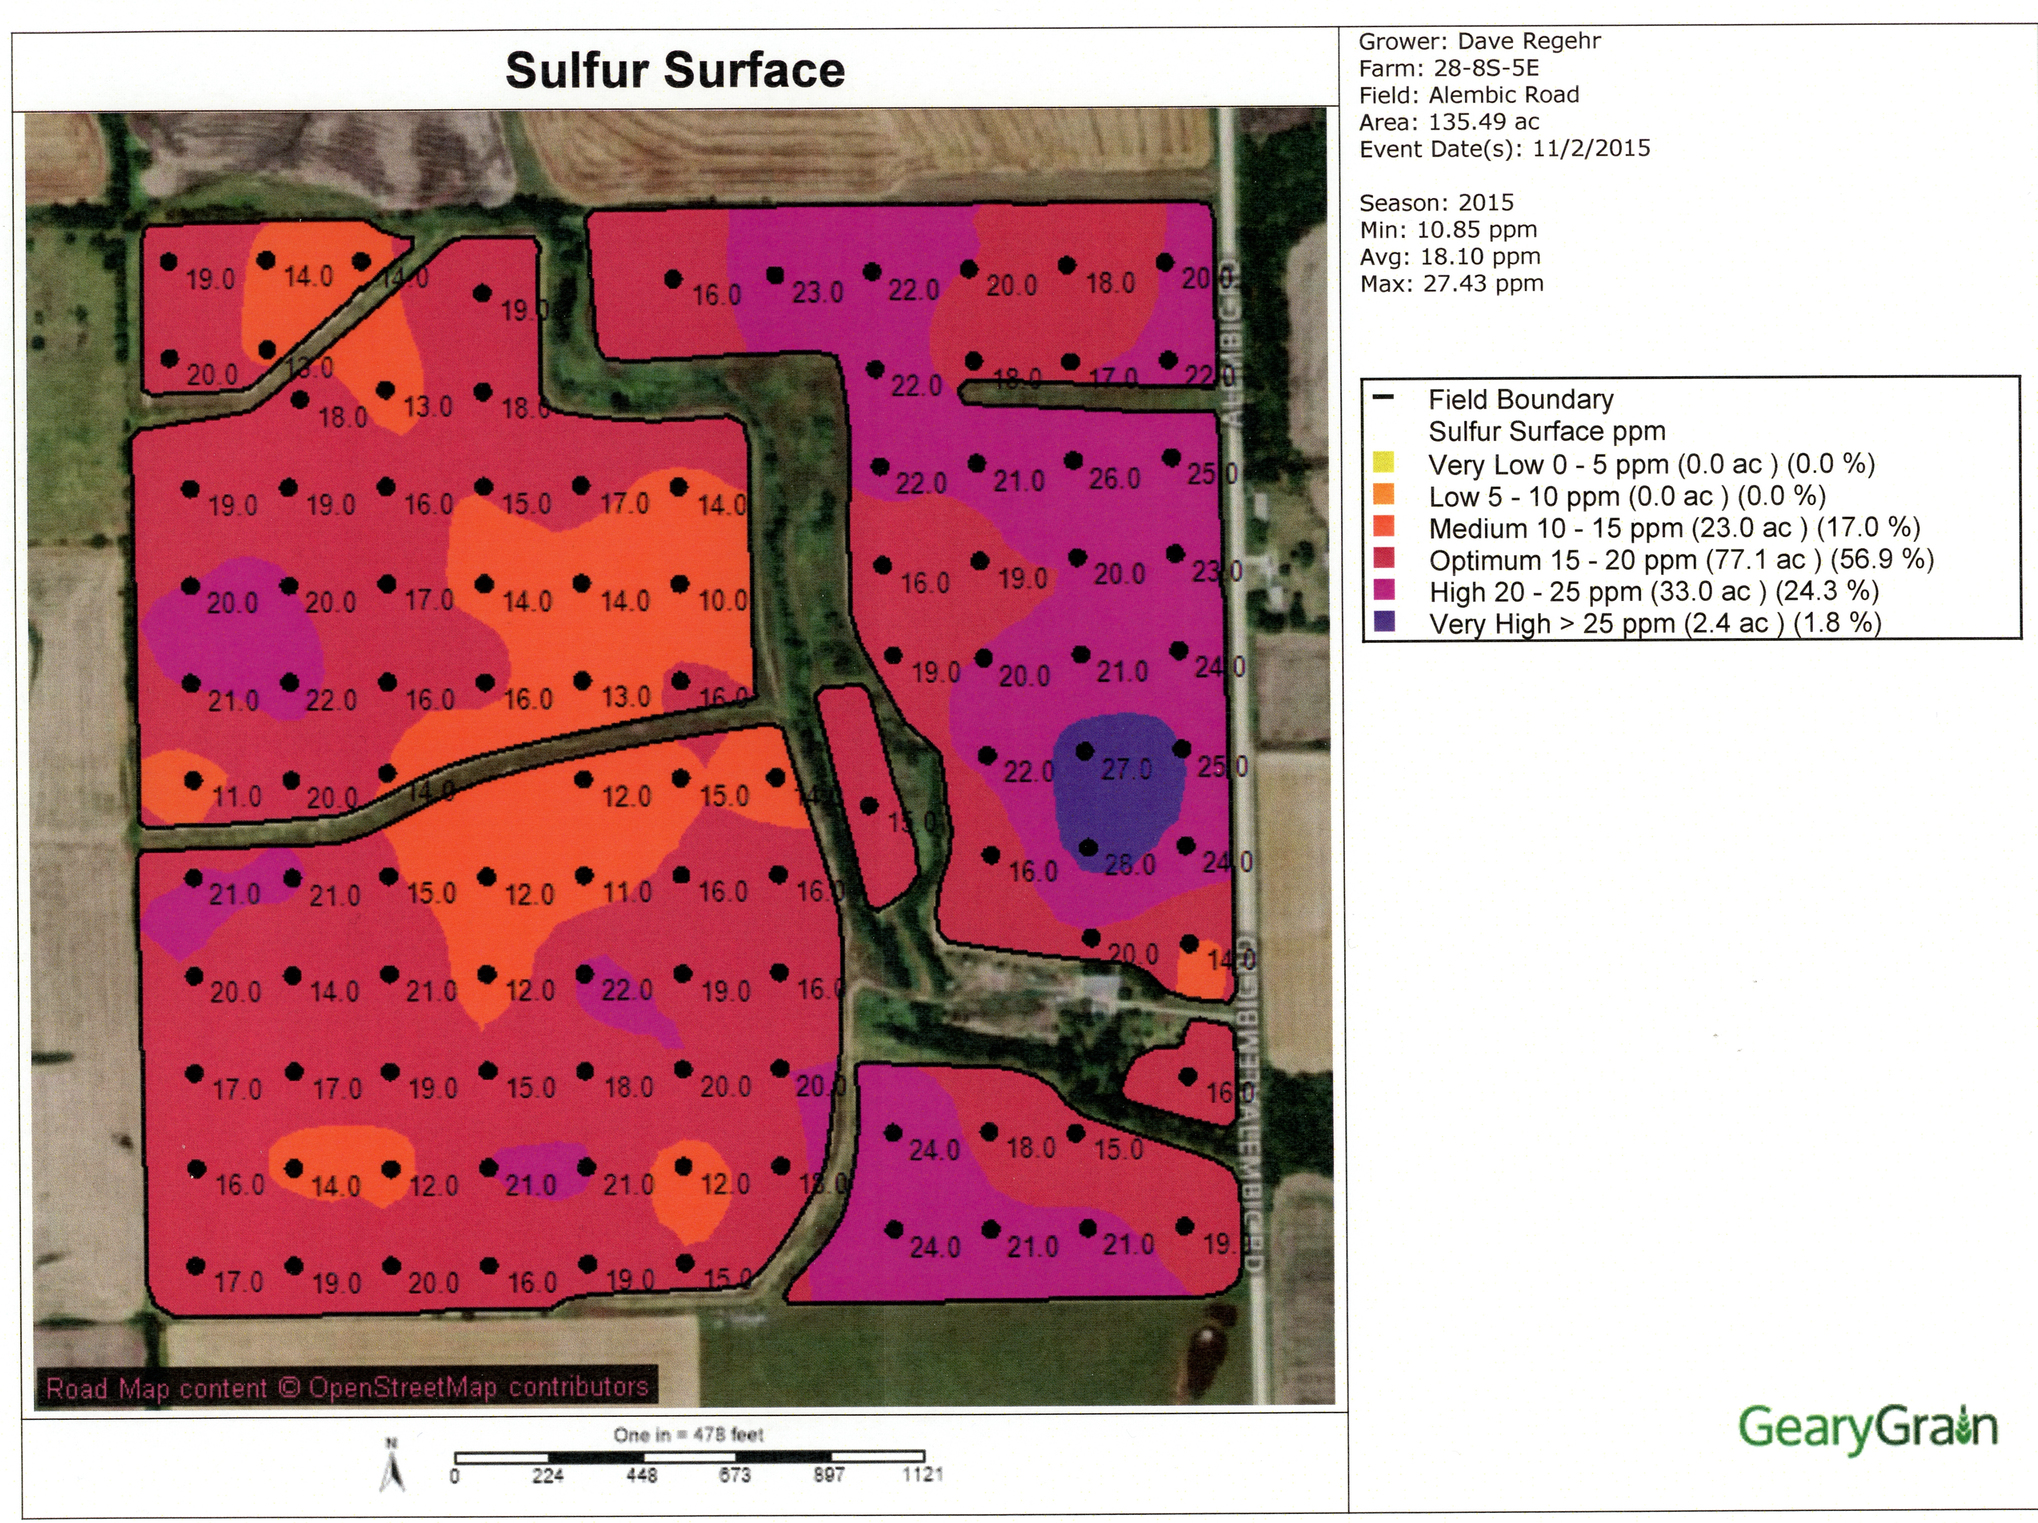
In the past it wasn’t necessary to fertilize with sulfur due to fallout from coal-burning power plants. This is no longer the case.
Another quantity that can be measured is crop yield: how much grain (or beans or whatever) is harvested at every point in a field? A combine harvester with a yield monitor and a GPS can determine this. “Point rows,” where a harvested swath comes to a point because the field is not completely rectangular, need to be specially taken into account: they cause the grain flow to be reduced not because yield is low but rather because the full width of the combine head is not being used. Yield data can be aggregated across years to look for real trends and to assess changes in how low-yield areas are treated.
Aerial measurement with drones or aircraft can be used to look for irregularities in a field: color and reflectivity at various wavelengths can indicate problems such as weeds (including, sometimes, identification of the offending species), insect infestations, disease outbreaks, and wet or dry spots. The alternative, walking each field to look for problems, is time consuming and risks missing things.
Some of the procedures in this section (maintaining a drone, intensive grid-sampling, interpreting soil test and yield results) are time-consuming and complicated, or require expensive equipment that would be poorly utilized if owned by an individual farmer. Such jobs can be outsourced to crop consultants who may be hired on a per-acre basis during the growing season to monitor individual fields for pests and nutrient problems, irrigation scheduling, etc. During the off-season, consultants may do grid sampling, attend subject-matter updates to maintain certification, and assist growers with data interpretation and planning, etc. Many crop consultants have years of experience, and see many fields every day; the services of this sort of person can reduce risks. Here’s the professional society for crop consultants and some companies that provide these services (1, 2).
Application
“Variable-rate application” means using the results of intensive soil grid sampling to apply seed, fertilizer, herbicide, insecticide, etc. in such a way that each location in the field receives the appropriate amount of whatever is being applied. For example, fewer seeds can be planted in parts of a field that have weaker capacity to store water in the soil, reducing the likelihood of drought stress.
Variable-rate can apply to an entire implement (planter or whatever) but it can also be applied at a finer granularity: for example, turning individual spray heads on and off to prevent harmful overspray or turning individual planter rows on and off to prevent gaps or double-planting on point rows and other irregularities. Imagine trying to achieve this effect using a 12-row planter without computer support:
 (Image is from this slide deck.)
Here’s the soil pH for my Dad’s farm and also the recommended amount of ag lime to apply for growing alfalfa:
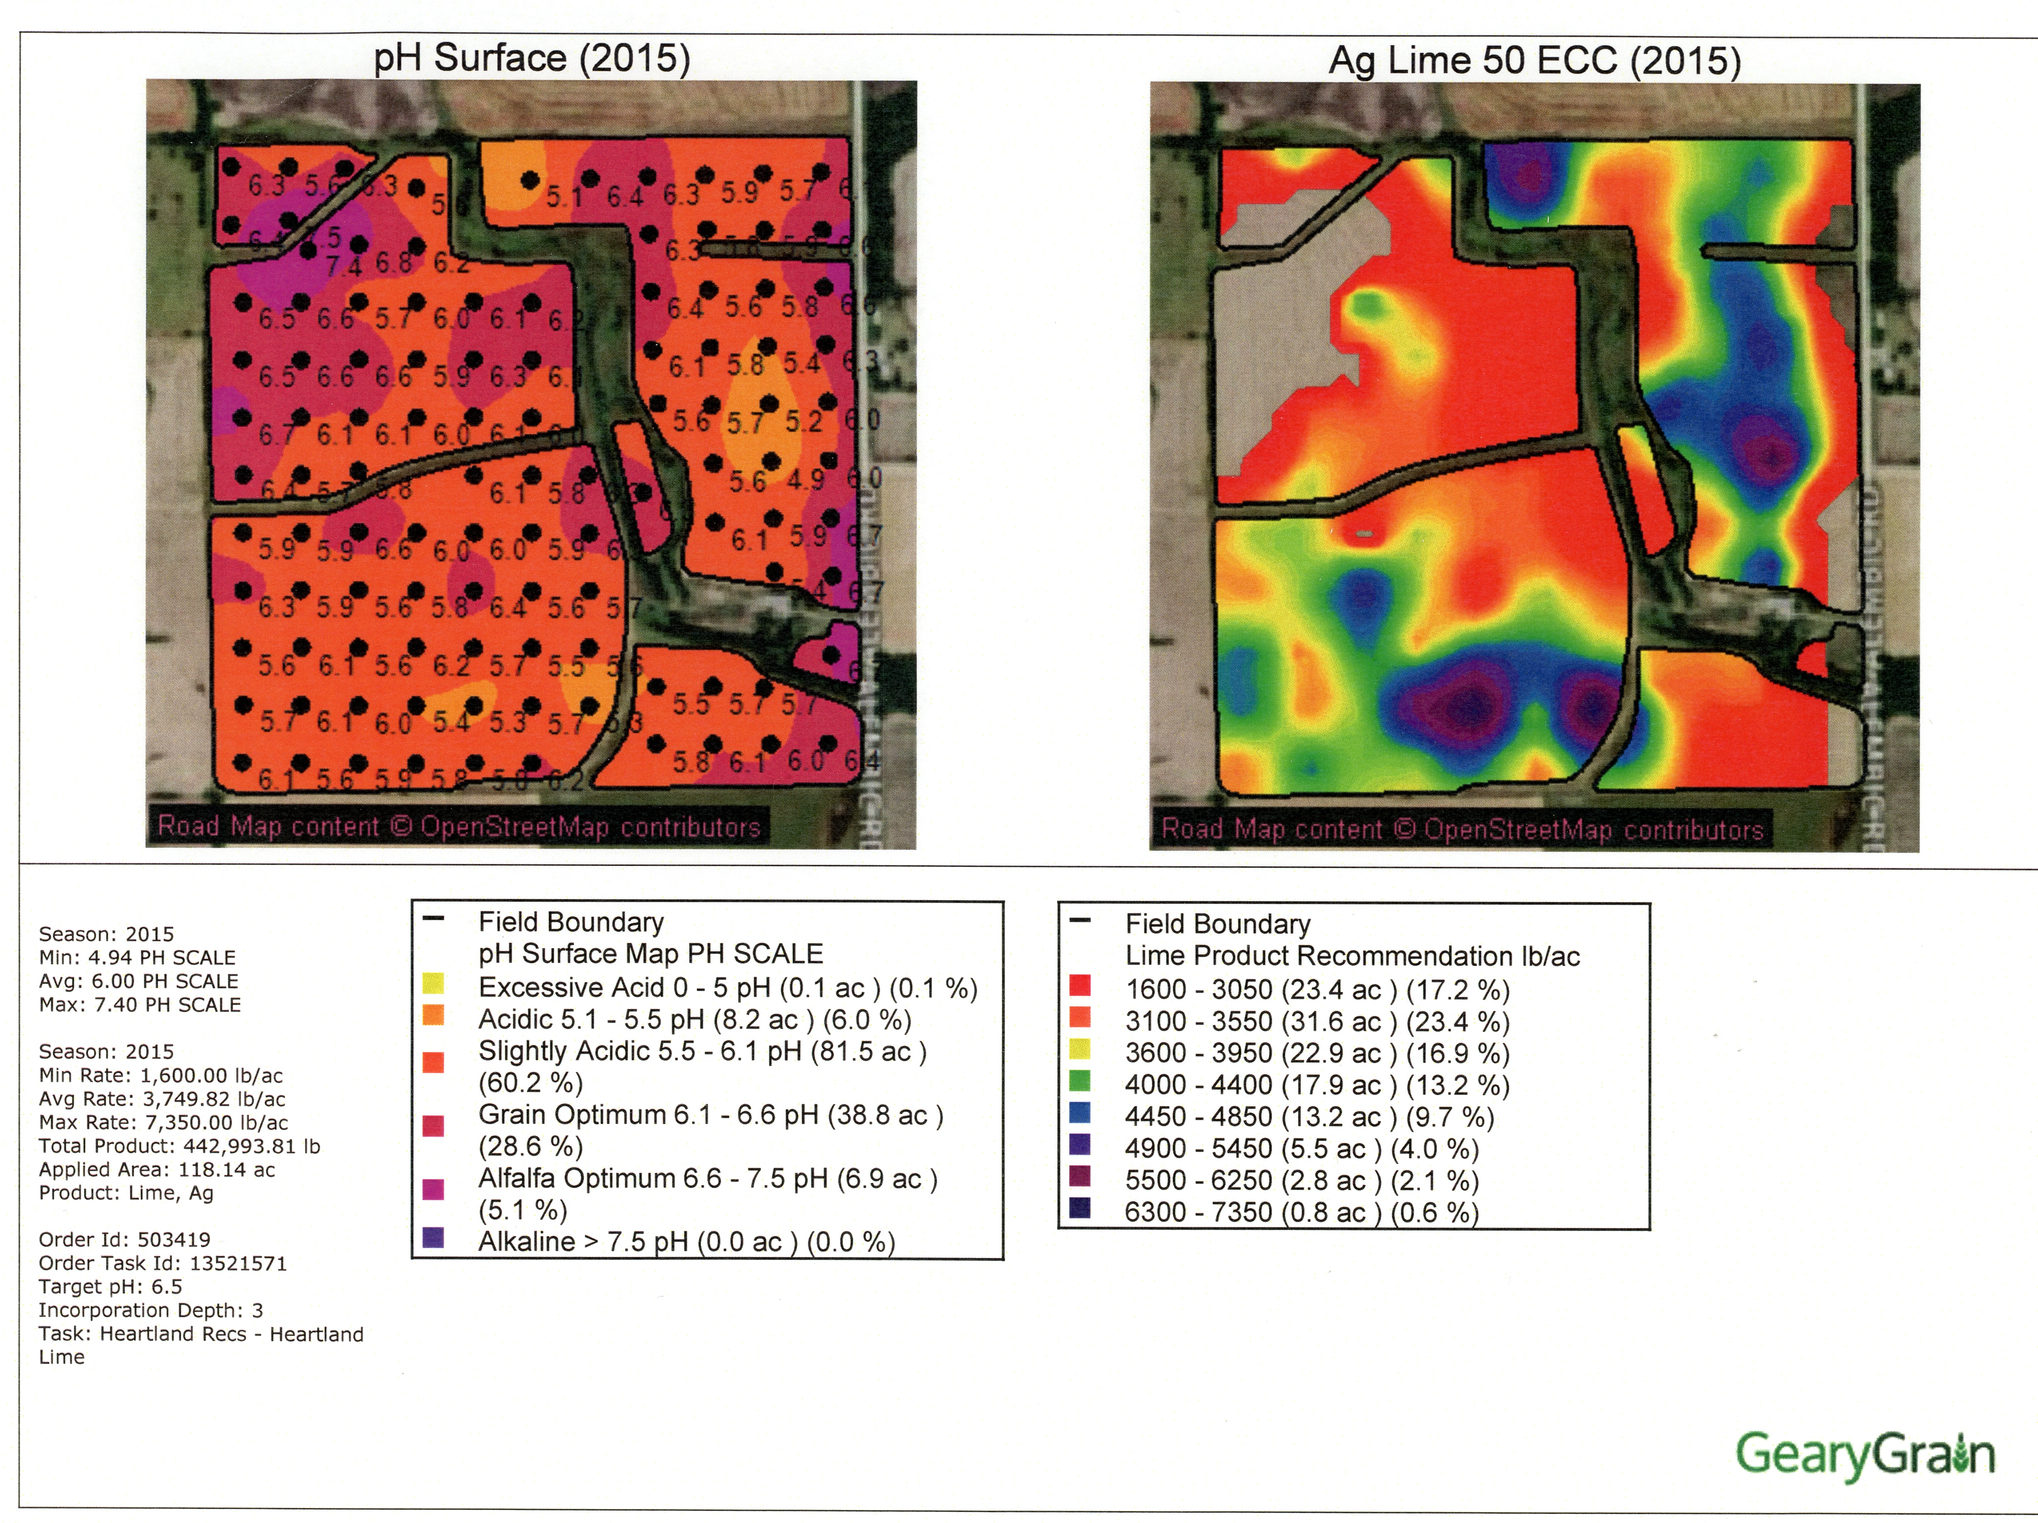
For cropland on this farm, 443,000 pounds (221 US tons / 201 metric tons) of ag lime are needed to bring the soils to the target pH of 6.5, the minimum pH for good alfalfa or soybean production. Purchase, hauling, and variable-rate application of ag lime in this area would be $20-25/ton, so the cost is roughly $5,000. However, because the land is farmed with no-till practices (i.e. no deep tillage to incorporate the lime), no more than about 1 ton/acre of ag lime is applied per year, so there will be a doubling or tripling of application costs, spread over several years, to some parts of the farm. Soil conditions will change in fairly predictable ways and it should be at least five years before these fields need to be sampled again.
Of course there are limits on how precisely a product can be applied to a field. Ag lime would typically be applied using a truck that spreads a 40′ swath of lime. Even if the spreader is calibrated well, there will be some error due to the width of the swath and also some error stemming from the fact that the spreader can’t instantaneously change its application rate. There might also be error due to latency in the delivery system but this could be compensated for by having the software look a few seconds ahead.
Here’s an analogous recommendation, this time for phosphorus in order to meet a target of 60 bushels per acre of winter wheat:
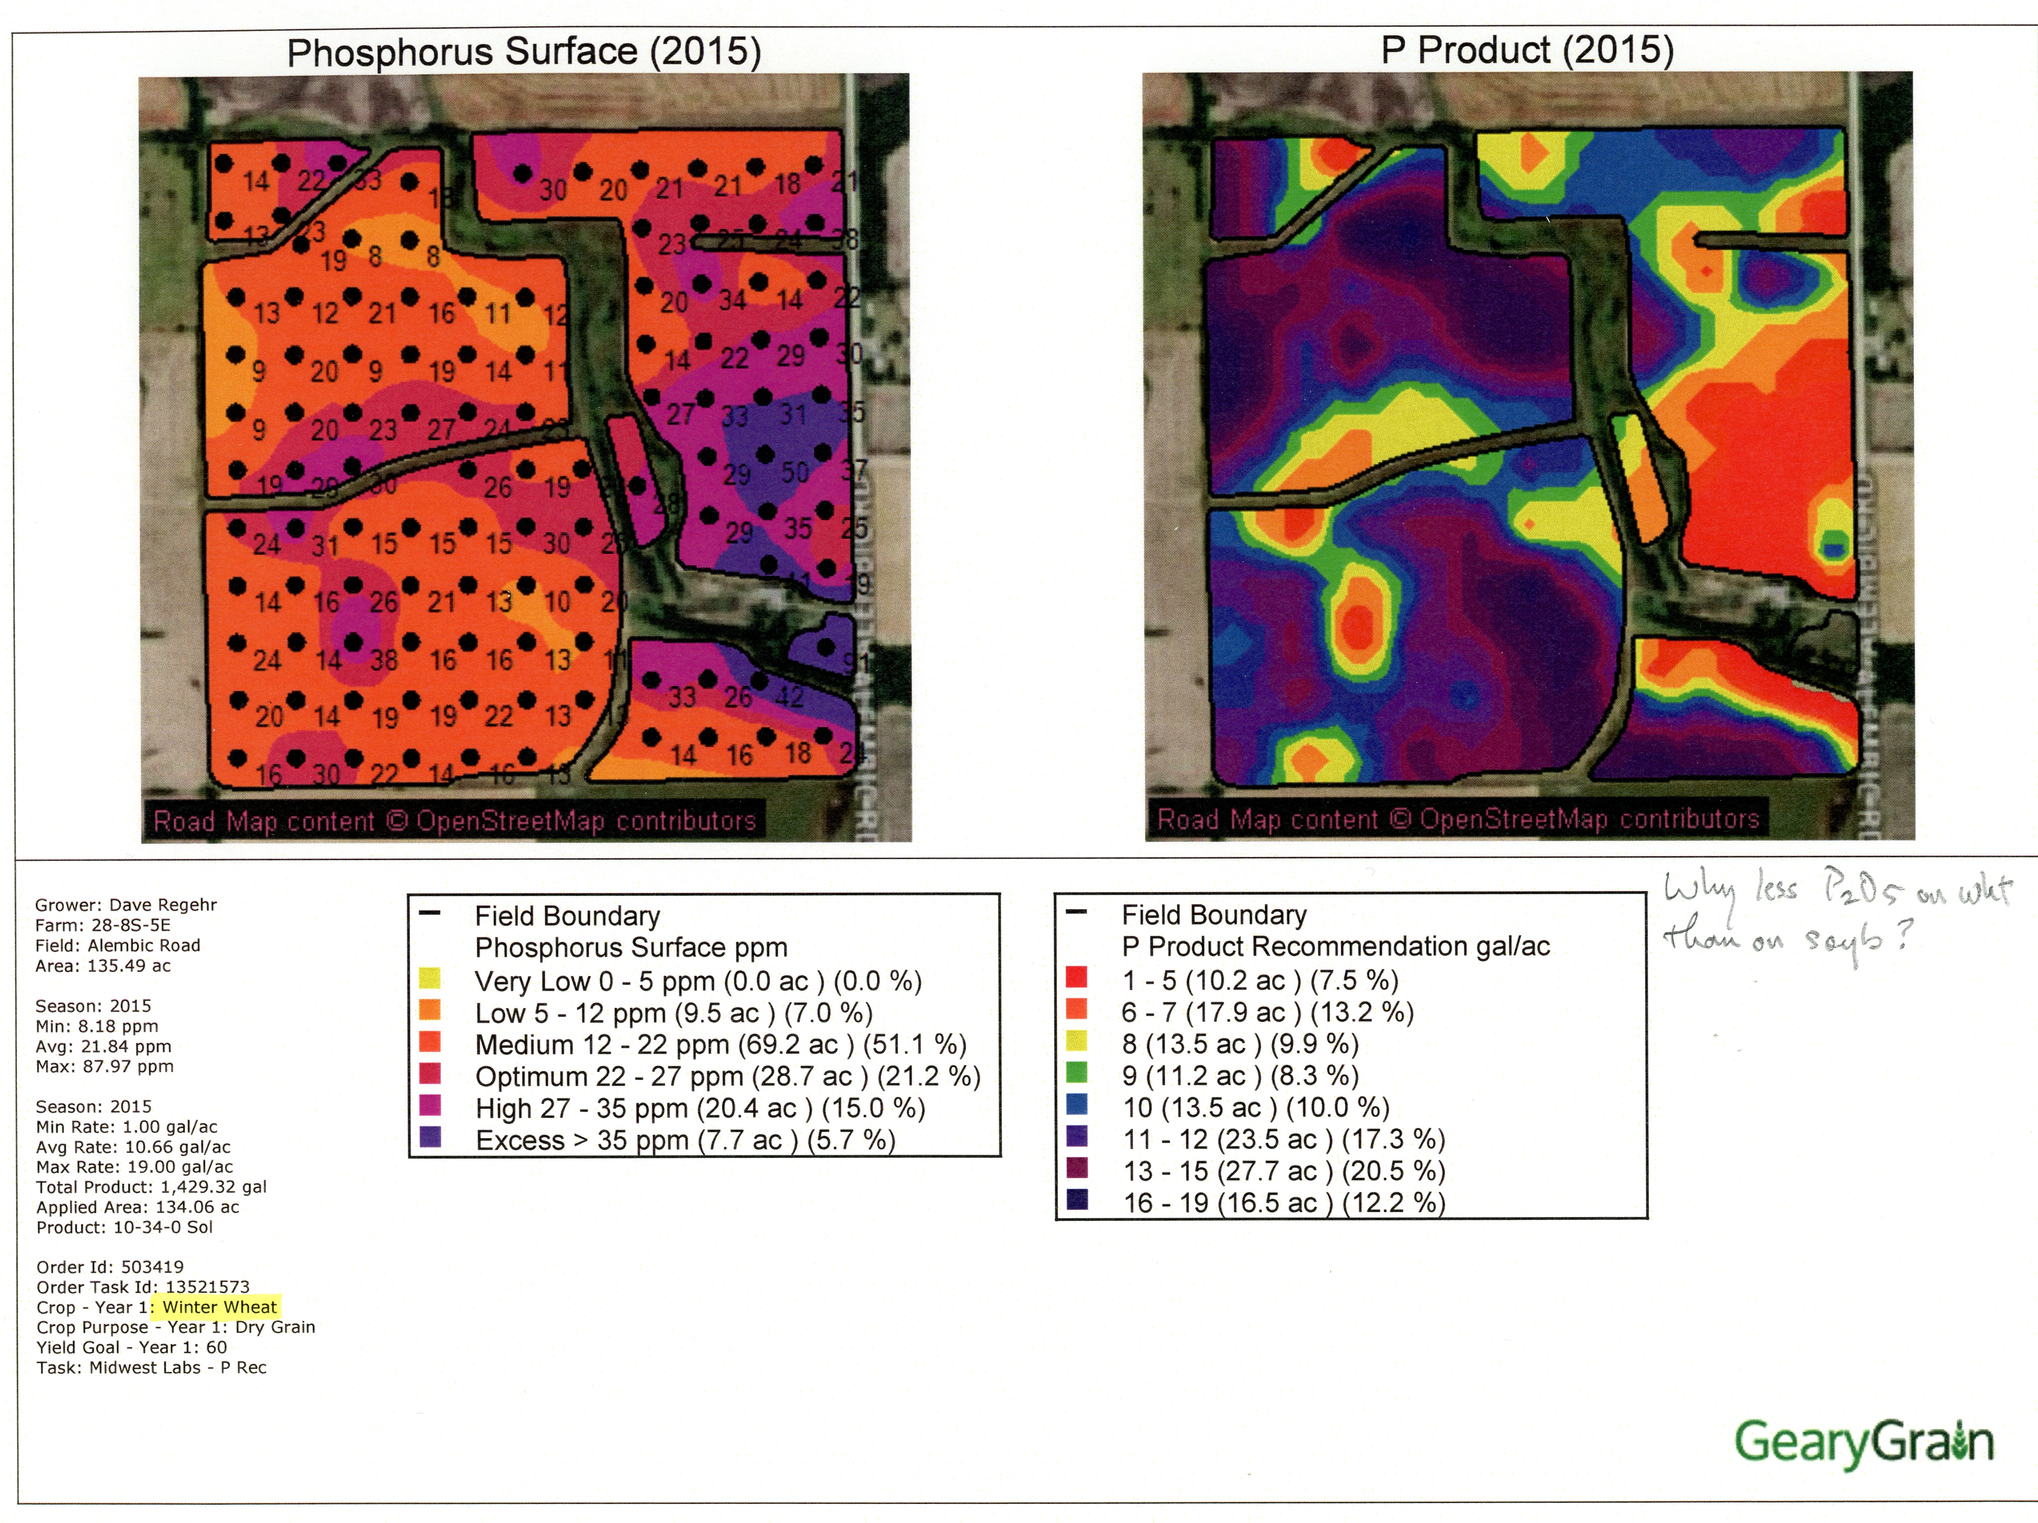
Phosphorus fertilizer application is an annual cost, which can vary greatly depending on type and price of formulation used. Most cropland farmers in this part of the world would figure on $25-35/acre for purchase and variable-rate application.
And finally, here’s the zinc recommendation for growing soybeans:
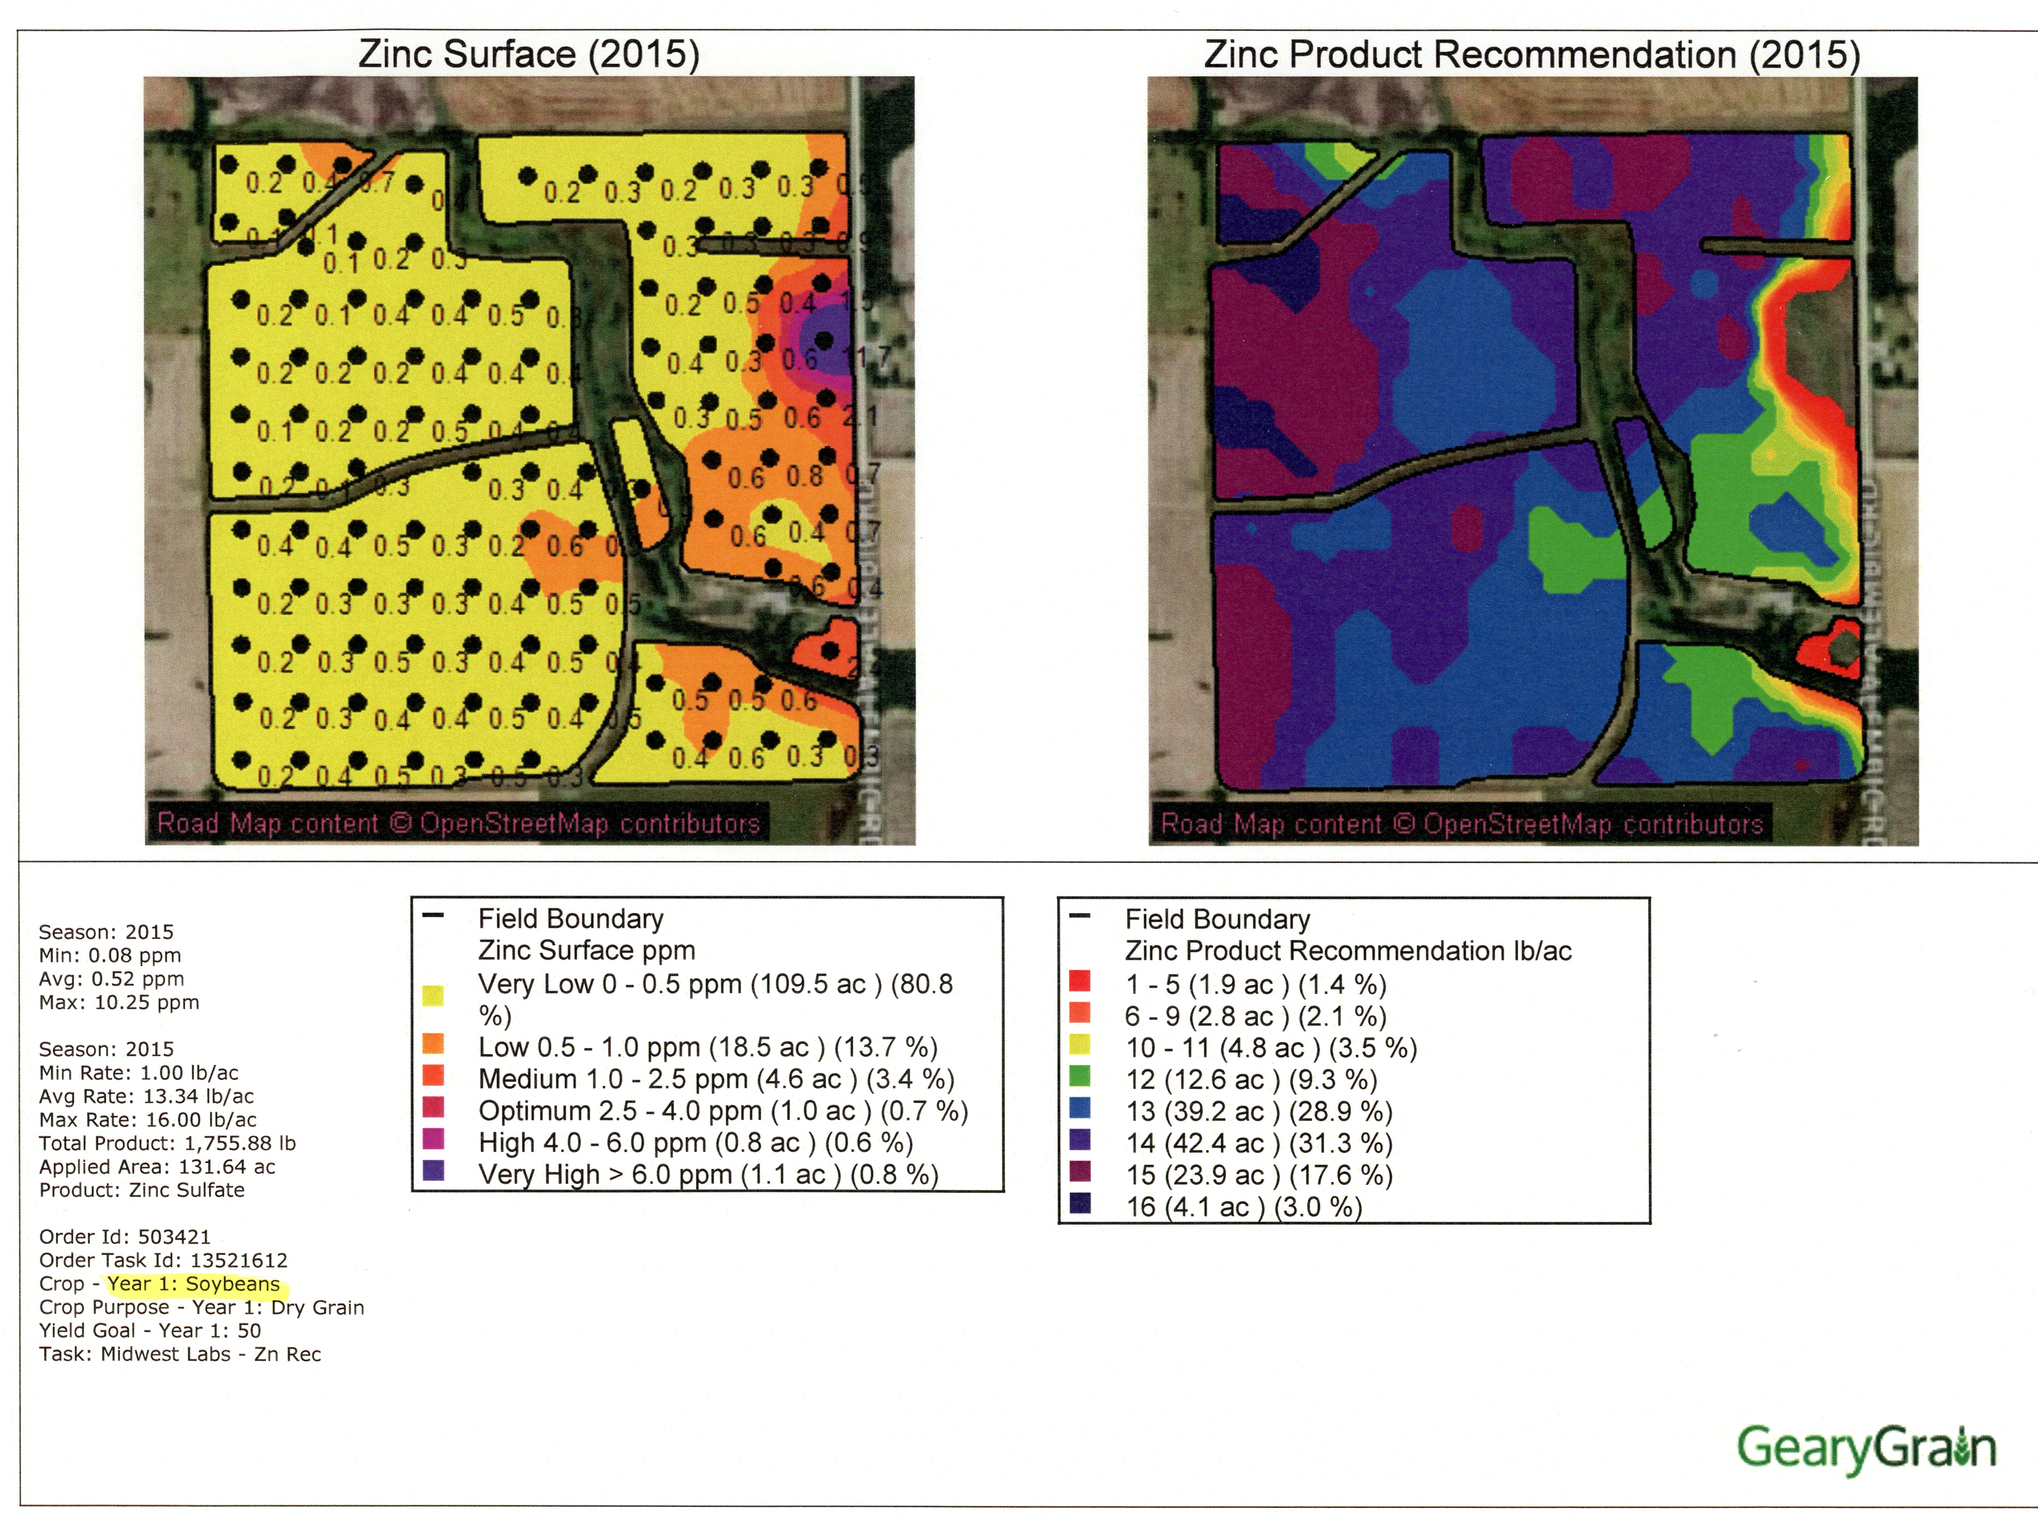
As you can see, much less zinc than lime is required: less than a ton of total product across the entire farm.
Automation
Driver-assist systems for cars are primarily about safety, and driverless cars need to pay careful attention to the rules of the road while not killing anyone. Automated driving solutions for tractors and harvesters seem to have evolved entirely independently and have a different focus: following field boundaries and swaths accurately.
An early automated row-following technology didn’t do any steering, but rather provided the farmer with a light bar that indicated deviation from an intended path. This was followed by autosteer mechanisms that at first just turned the steering wheel using a servo, and in modern machines issues steering commands via the power (hydraulic) steering system. The basic systems only handle driving across a field, leaving the driver to turn around at the end of each row. To use such a system you might make a perimeter pass and then a second pass around a field; this provides room to turn around and also teaches the autosteer unit about the area to be worked. Then, you might choose one edge of the field to establish the first of many parallel lines that autosteer will follow to “work” the interior of the field. Static obstacles such as trees or rocks can be marked so the GPS unit signals the driver as they’re approached. Dynamic obstacles such as animals or people are not accounted for by current autosteer systems; it’s still up to the driver to watch out for these. Autoturn is an additional feature that automates turning the tractor around at the end of the row.
Autosteer and autoturn aren’t about allowing farmers to watch movies and nap while working a field. Rather, by offloading the tiring, attention-consuming task of following a row to within a couple of inches, the farmer can monitor the field work: Is the planter performing as expected? Has it run out of seed? Autosteer also enables new farming techniques that would otherwise be unfeasible. For example, one of my cousins has corn fields in central Kansas with 30″ row spacing, that are sub-surface irrigated using lines of drip tape that are buried about 12″ deep, spaced 60″ apart. Sub-surface irrigation is far more efficient than overhead sprinkler irrigation, as it greatly reduces water loss to evaporation. As you can imagine, repairing broken drip tape is a difficult, muddy affair. So how does my cousin knife anhydrous ammonia into the soil to provide nitrogen for the corn? Very carefully, and using RTK-guidance (next paragraph) to stay within 1-2 cm of the intended path, to avoid cutting the drip lines.
GPS readings can drift as atmospheric conditions change. So, for example, after taking a lunch break you might find your autosteer-guided tractor a foot or two off of the line it was following an hour earlier. My Dad says this is commonplace, and there can be larger variance over larger time scales. Additionally, it is expected that a GPS will drop out or give erratic readings when signals reflect and when satellites are occluded by hills or trees. So how do we get centimeter-level accuracy in a GPS-based system? First, it is augmented with an inertial measurement unit: an integrated compass, accelerometer, and gyroscope. I imagine there’s some interesting Kalman filtering or similar going on to fuse the IMU readings with the GPS, but I don’t know too much about this aspect. Second, information about the location of the GPS antenna on the tractor is needed, especially the height at which it is mounted, which comes into play when the tractor tilts, for example due to driving over a terrace. Third, real-time kinematic uses a fixed base station to get very precise localization along a single degree of freedom. Often, this base station is located at the local Coop and farmers pay for a subscription. This web page mentions pricing: “Sloan Implement charges $1000 for a 1 year subscription to their RTK network per radio. If you have multiple radios on the farm, then it is $2500 for all of the radios on a single farm.”
A farm’s income depends entirely on a successful harvest. Often, harvesting is done during a rainy time of year, so fields can be too wet to harvest and in the meantime if a storm knocks the crops down, yields will be greatly reduced. Thus, as soon as conditions are right, it is imperative to get the harvest done as quickly as possible. In practice this means maximizing the utilization of the combine harvester, which isn’t being utilized when it is parked next to a grain wagon to unload. It is becoming possible to have a tractor with a grain cart autonomously pull up alongside a working combine, allowing it to unload on-the-go, without requiring a second driver.
Conclusions
The population of the world is increasing while the amount of farmland is decreasing. Precision agriculture is one of the things making it possible to keep feeding the human race at an acceptable cost. I felt that this piece needed to be written up because awareness of this material seemed low among computer science and computer engineering professionals I talk to.
10 responses to “Introduction to Precision Farming”
Wow, Good to know that acre is used as metric. Here too in India. No one understands hectare in common farming lingo here.
That was super interesting, thanks for writing, John!
Really cool to see data visualization and analysis on farming!
What a great write-up! Keep up the good work, the world needs more efficient _____.
This is pretty much the picture I get from watching AgPhD, reading The Furrow and related media. Research likely goes further, as Lidar, drones, genetics, endemic microfauna, weed surveillance, herbicide and pesticide monitoring/control are in scope for automation. Beyond industrial grain and row crops, you have different considerations in orchards, vineyards, and especially livestock/aquaculture. All these have potential computing application, though I suspect the highest value currently is found on the futures/finance part of the operation. Yet a woolly-headed part of me wonders if Michael Pollan might be on to something, that how we grow food is more than chemical factory production.
As of today, is it a common practice to generate value from integrating all variable layers of the Precision Ag data for recommendation to the farmer? Is application of machine learning algorithms to Precision Ag data to generate key insights a common practice today? For example, modeling yield data, variable rate of fertilizer data, weather data, herbicide, fungicide etc to generate value of maximizing profits with minimizing costs and quantification of relationship among these variables. Appreciate your insights in the blog post.
Very happy to hear about farming from software engineer perspective.
You’re right that there’s a lot of potential for computer science in the farming industry – I recently joined a startup doing just this kind of analysis of precision data. We’re doing a lot of work to put actual quantitive analysis behind some of the conventional wisdom and helping farmers understand where the big input suppliers might be leading them astray in their efforts to sell them more.
e.g. How densely should you plant your seed? the seed suppliers will of course urge you to buy more and plant at higher densities, but we can show exactly when that increase starts to lead to diminishing returns.
If your father’s farm has precision data then you should definitely get him to try out our system – and if you’d like to hear more behind the scenes details about what we’re up to I’d love to chat. More info here: https://www.farmersbusinessnetwork.com/analytics/seed-agronomics
(I came here trying to find a link to your stuff on super optimizers, happy accident to find you interested in farming as well!)
Ultimately, I have to wonder if agriculture itself will become obsolete. The problem is the overall energy efficiency (from sunlight to food energy) is very low, typically less than 1%. This means very large areas of land are required to grow enough food.
It’s possible to grow bacteria using electricity as their energy source (plus CO2, etc. to get the atoms to rearrange into more bacteria, but CO2 can be extracted from air with about 0.1% of the land required for crops.) Commercial photovoltaic panels are currently > 20% efficient, and can be used in places and climates where crops will not grow, and do not transpire any water. Of course plants are the prototypical self-reproducing machines, so they have a considerable advantage in capital cost.
That was great John. Thanks for writing it up.
Some years ago my brother-in-law, a wine maker, showed me a new vineyard going in from the vantage point of a light plane. He explained how it worked—they were doing similar things. The vineyards are drip-irrigated, so they can use that to provide some fairly fine-grain control over nutrients etc. It was pretty spectacular to see it going in at scale. The implications for efficiency (and quality!) are huge.